The First Digital Divide: Access and Connectivity
Over the last several decades access to computing devices and internet connectivity in schools has greatly accelerated.
Access:
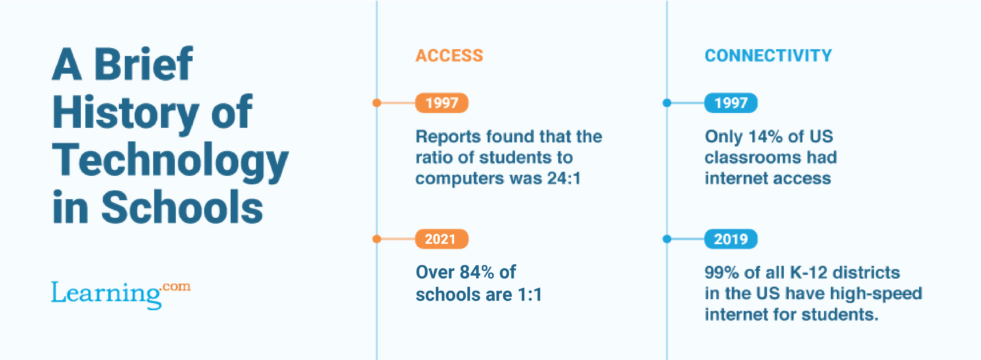
In 1997, reports found that the ratio of students to computers was 24:1. By 2017, over 50% of educators reported that their school is 1:1. But the COVID-19 pandemic created an urgent need for districts to provide devices to students. By March 2021, 90% of districts were 1:1 for their middle and high school students, and 84% were providing 1:1 for their elementary students, too.
Connectivity:
Only 14 percent of US classrooms had internet access in 1997. But in 2019, EdWeek research confirmed that 99 percent of all K-12 districts in the United States have high-speed internet with 100 kpbs for students.
Digital inequity persists with ensuring connectivity in family homes, public libraries, and other after school gathering areas.
Access and Connectivity Beyond the School Walls
According to recent surveys:
- 87 percent of households had a desktop or laptop (source).
- 85 percent had a smartphone.
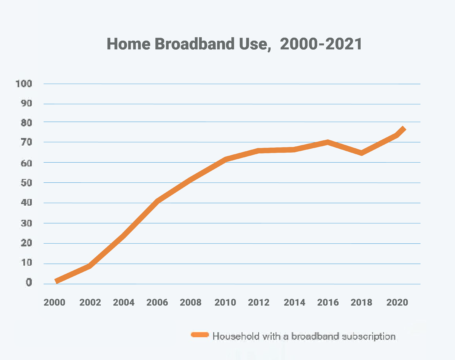
- 77 percent had a broadband subscription.
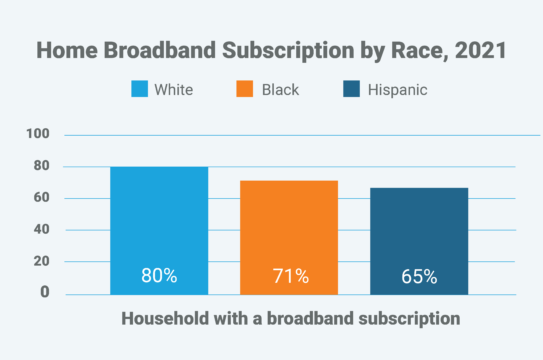
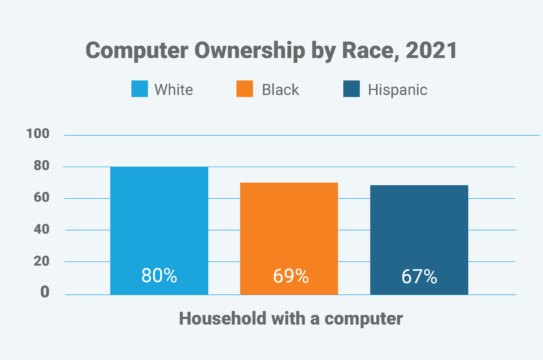
EXAMPLE 1: COMPUTER OWNERSHIP AND BROADBAND SUBSCRIPTION RATES BY RACE
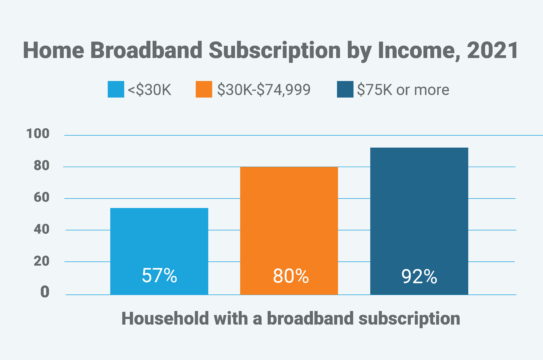
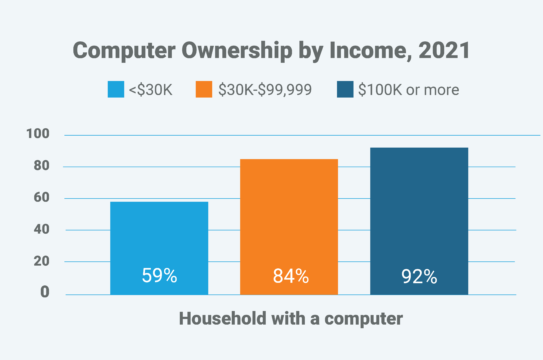
EXAMPLE 2: COMPUTER OWNERSHIP AND BROADBAND SUBSCRIPTION RATES INCOME
EXAMPLE 3:COMPUTER OWNERSHIP AND BROADBAND SUBSCRIPTION RATES BY LOCATION
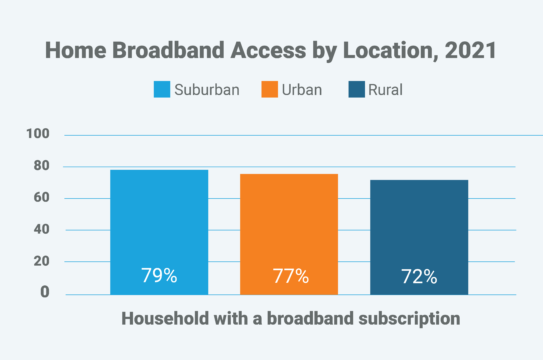
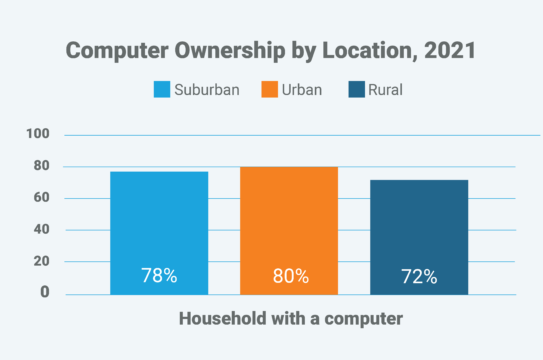
The takeaway is fairly simple: access and connectivity rates are impeded by longstanding inequities in society that affect traditionally underserved minorities, low-income families and those residing in rural areas.
The Access and Connectivity Divide & Equity
The persistence of the access and connectivity divide, which runs in parallel with learning that depends upon access to devices and connectivity to the internet, further alienates students who are already underserved and disadvantaged.

The Second Digital Divide: Digital Readiness
A report from the Information Technology and Innovation Foundation, quantified this divide among adult Americans:
- 13 percent of U.S. workers have no digital skills
- 18 percent of American adults have at best limited digital skills
- 35 percent of American workers have proficient digital skills
- 33 percent of U.S. adults are considered to have advanced digital skills
In general in the workforce:
- Demand for digital skills is increasing across industries
- Job growth is stronger in jobs that require more digital skills
- The more highly digitalized industries have faster-growing wages
But What About Digital Natives?
In a separate study by Pew, researchers surveyed adult Americans to gauge their Web IQ.
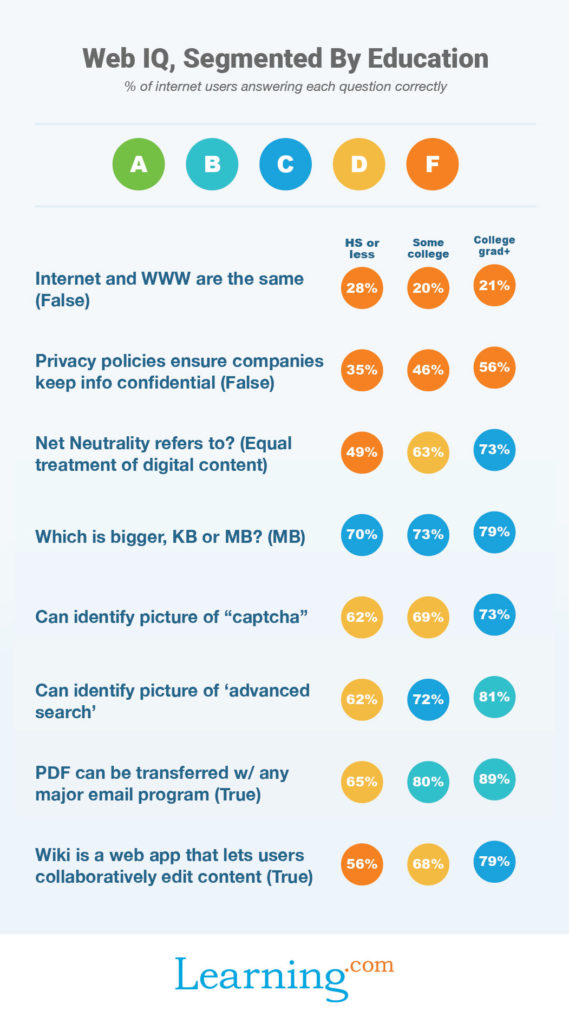
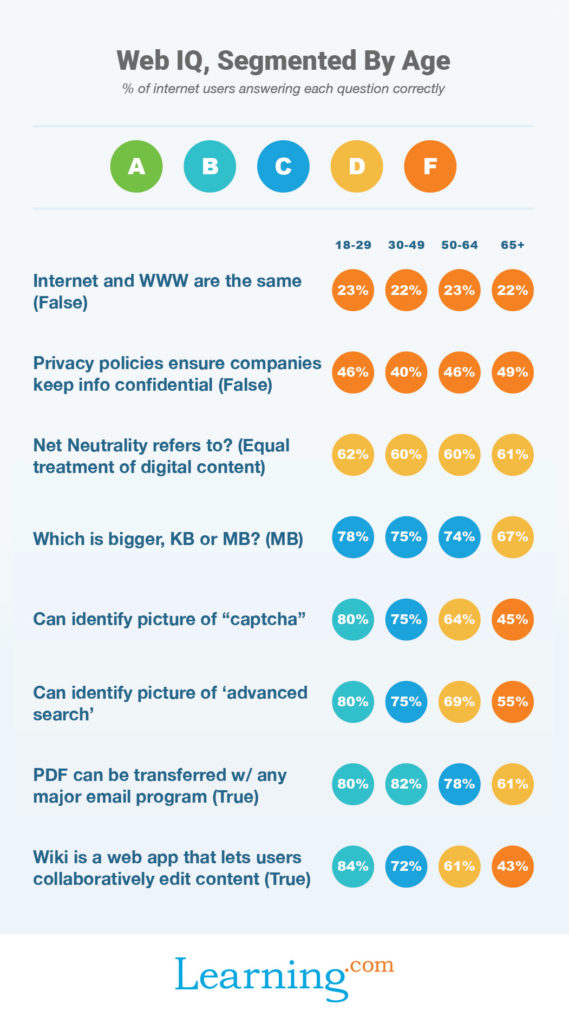
Findings:
- Age isn’t an accurate predictor of digital readiness.
- Education tends to be an accurate predictor.
Why does this matter? The digital native narrative often overlooks and even perpetuates the digital readiness divide among youth, according to research by Paul A. Kirschner and Pedro De Bruyckere.
The Digital Readiness Divide & Equity
Students who lack access and connectivity, whether in school or at home, have less experience using technology and are likely to have families with less experience. The digital readiness divide, in this context, is more likely to impact non-white, impoverished, and rural students, which preys on already existing inequity.
The Third Digital Divide: Digital Use
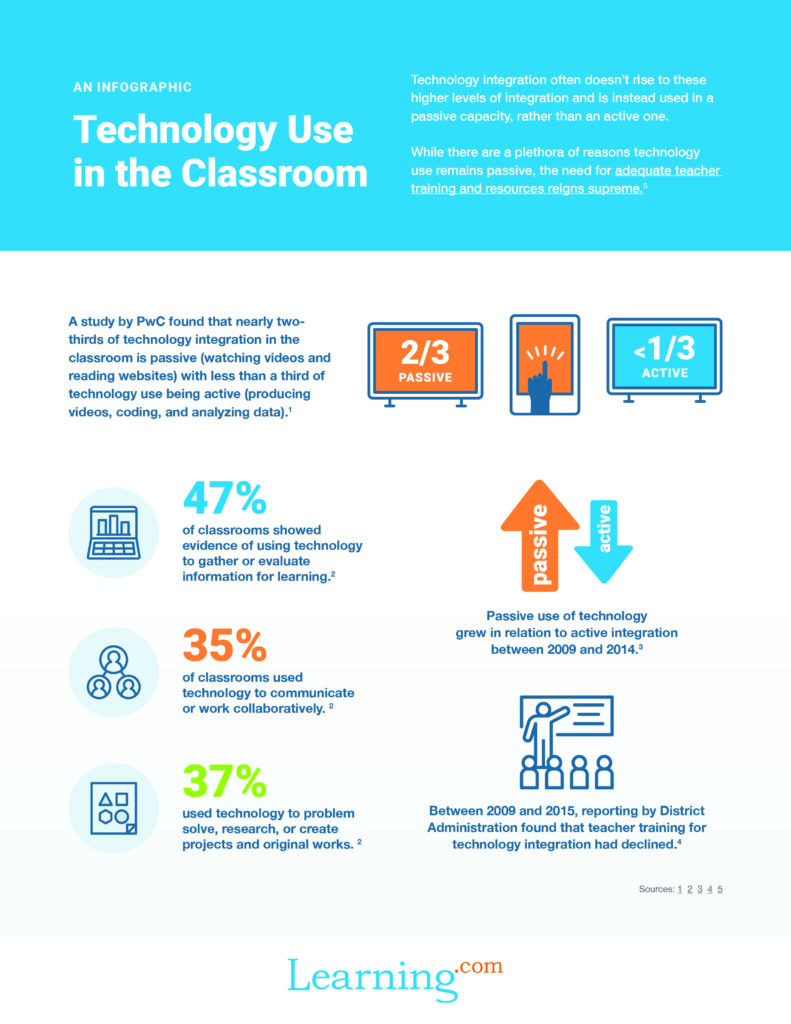
The digital use concerns the nature of technology integration in student learning.
Technology Use in the Classroom
The Digital Use Divide and Equity
A study by Connected Learning Alliance found that students in higher-income schools experienced technology as a creative and playful medium while those from middle and lower-income schools used it at a far more basic level.
A second report also uncovered that lower-income, non-white children were more likely to use technology for drill and practice compared to their more affluent peers, who used technology in learning for problem solving and higher-order thinking.

The Fourth Digital Divide: Representation
The fourth digital divide, as featured in our digital equity whitepaper, is in reference to representation in the learning content, technology industry, and computer science workforce.
In order to feel a sense of belonging, connection to the curriculum, and empowerment to pursue advanced academics and employment in technology, diversity and representation are necessary.
In an article by Kevin Clark in the Journal of Children and Media, he explains:
“The digital divide will not be truly closed until the content available reflects the full spectrum of our experiences and perspectives, so that fathers and mothers of all hues and demographic categories have access to books, videos, websites, and a whole host of media created by and containing characters who look like their daughters and sons.”
Especially in STEM and computer science contexts, special considerations need to be made to ensure that learning represents all students, even when the fields may lag in this.
A Computer Science Case Study
To illustrate the lack of diversity and representation, the following section will examine the computer science field as an example. In the industry: 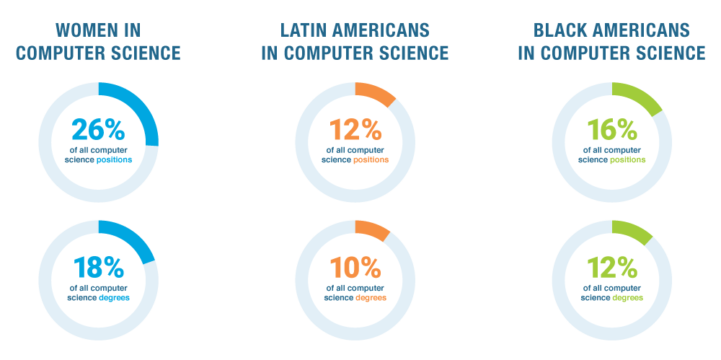
This lack of representation impacts us all.
Pipeline Build:
- In 2020, unfilled computer science positions reached over one million.
- Computer science jobs are expected to grow 22% by 2030 – much faster than average
- Only eight percent of college graduates in STEM elect to major in computer science.
Technology Accessibility:
- Speech recognition software with smart speakers is more likely to understand men than women, and the same is true for people with accents.
- Another example is that facial recognition software repeatedly fails to recognize women and people of color, which again is in part due to the gender and race of those designing it.
Wealth Gaps:
- Greater equity in the computer science workforce will also help to close gender and racial wealth gaps by enabling these groups to access higher incomes that empowers them, their family and their community.
In Support of Representation
It’s essential that all students have access to computer science and technology-driven learning experiences.
A study by Computer Science Education Week found that the likelihood women will major in computer science increases tenfold when they are enrolled in AP Computer Science. And Black and Latinx students are seven times more likely to major in it.
Beyond reaching younger students, progress will also require that curriculum be inclusive and representative.
In summary of all this data, Michele Knobel and Leeann Stone in the Educational Policy Journal explain:
“There is no single digital divide in education but rather a host of complex factors that shape technology use in ways that serve to exacerbate existing education inequalities.”
This article was originally published by Learning.com in October 2020. Data and information have been updated to reflect current trends.

Learning.com Team
Staff Writers
Founded in 1999, Learning.com provides educators with solutions to prepare their students with critical digital skills. Our web-based curriculum for grades K-12 engages students as they learn keyboarding, online safety, applied productivity tools, computational thinking, coding and more.
Further Reading

Digital Skills for North Carolina Students
In our district, like most others, the use of digital learning tools has catapulted since the pandemic. With students online more than ever, it’s...

Why Teaching Kids to Code Supports Community Development
Teaching kids to code undoubtedly prepares them for the future of work. But what does this mean for the communities that helped them become career...

Enhancing Digital Citizenship by Understanding Confirmation Bias
Teaching confirmation bias as part of the digital literacy curriculum in schools is essential in today's information-saturated world. Confirmation...